Year in Pixels
A whole year you can see at once
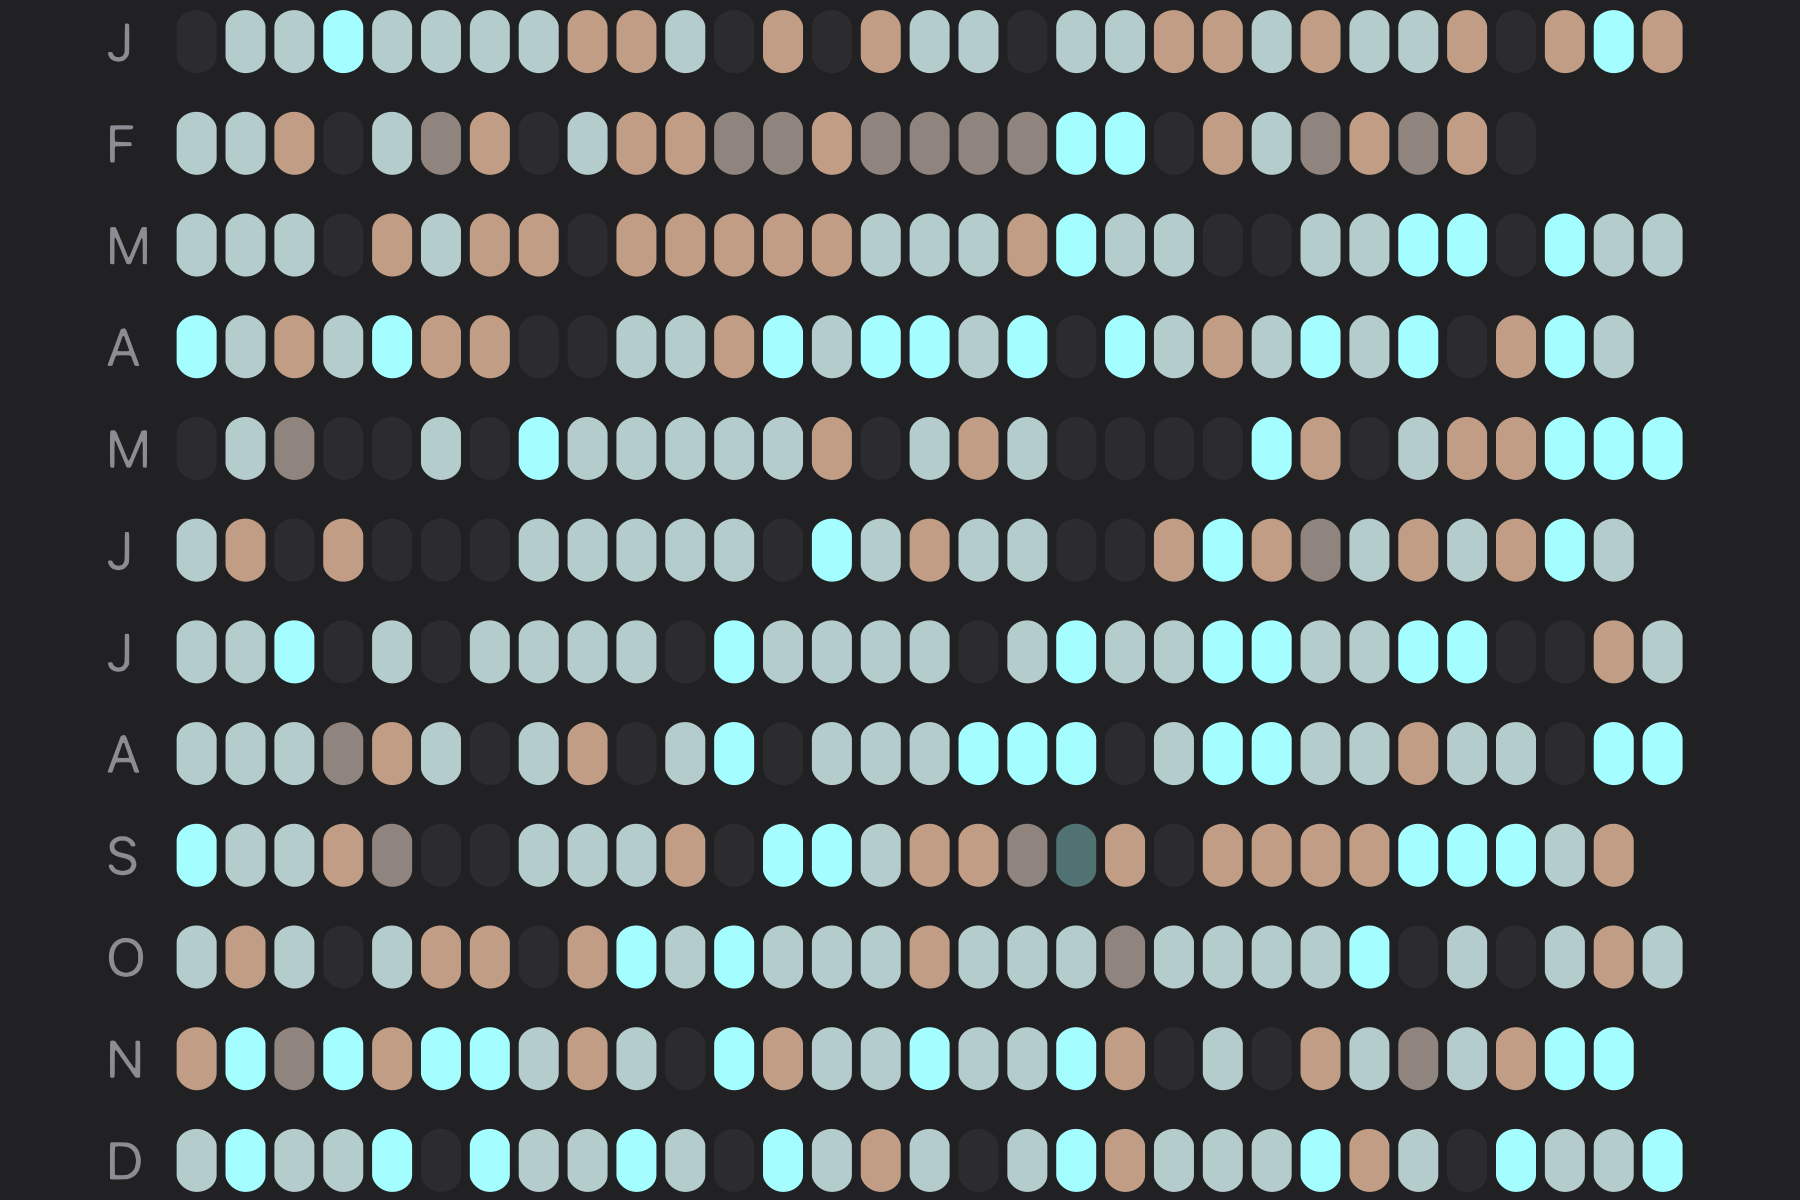
One square per day, coloured by how it went. It's the rare tracking habit that pays you back in something you actually want to look at.


Ask someone how last March was and you'll get a shrug. A year is simply too much to hold in your head, so we compress it to a handful of events and lose the rest. Turn it into a field of colour and it reads instantly: the seasons, the hard stretches, and the long quiet runs of perfectly fine days that memory throws away because nothing happened. The habit started in bullet-journalling communities, where people drew the grid by hand on the first page of a new notebook. Luci fills it in as you log, but the idea is theirs and it's a good one.
What people find in their first year
Three things show up again and again. Seasons, moving with the light. Most people half expect this and are still struck by seeing it laid out. A weekday that's reliably paler than the others, which you find by reading down the columns rather than across the rows, and which one it turns out to be is usually a surprise. And runs rather than single days: four, five, six squares at the same level. A single bad day is far less interesting than it feels at the time. It's the stretches that are worth thinking about, and they're nearly invisible while you're inside one.
colors that read as a gradient
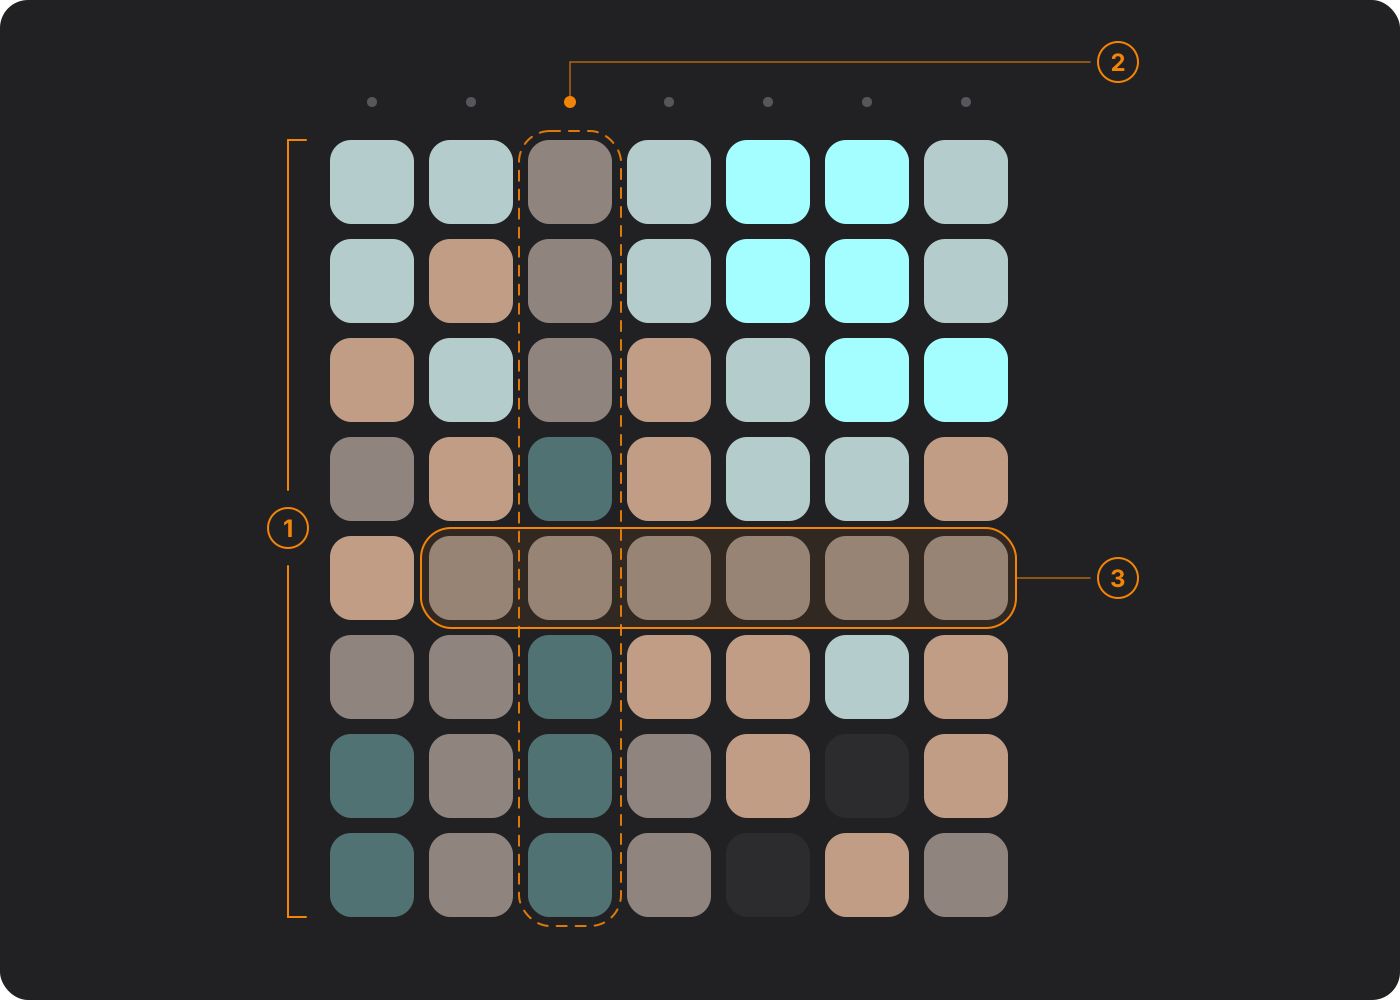
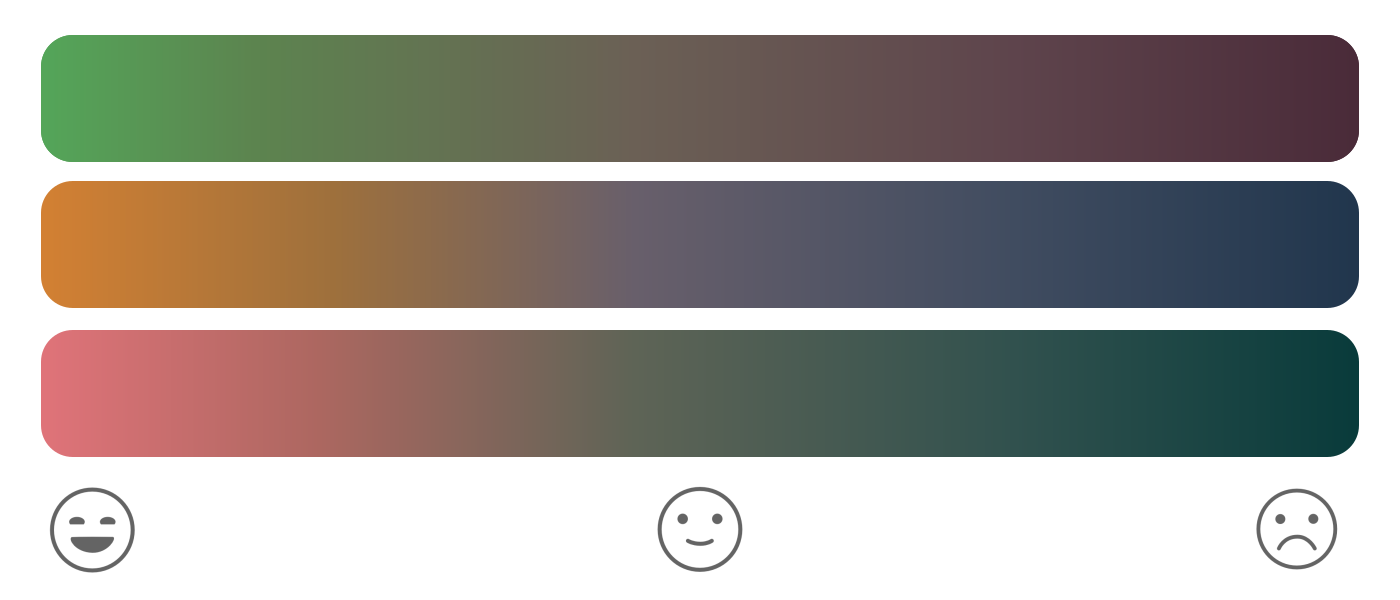
A grid only works at a glance if the colors run along a single axis: warm to cool, dark to light, muted to vivid. The common first attempt is red for bad, blue for sad, yellow for good, green for great: four unrelated colors that turn a year into confetti you have to check a key to read, and a grid you check a key for is a grid you stop opening. Two practical warnings. Don't put red and green at the two ends, because roughly one man in twelve can't reliably tell them apart and your grid becomes a flat wall to them. And don't use pure white for your best days, or blank squares and brilliant ones become indistinguishable. Seeing which days you missed is half the value.
Paper still works beautifully
There's real pleasure in filling a square by hand, and if that's what makes the habit stick then paper is the better tool. Draw twelve columns and thirty-one rows, months across the top, dates down the side. A page and a half in a dot-grid notebook gives you squares big enough to see. The one thing a notebook can't do is anything further with the data: it will show you a hard fortnight beautifully and has no way to help you work out what was different about it. That's the whole trade, and for plenty of people paper still wins it.
Who this is for
For people who want something to look at, not just something to fill in.
You keep a bullet journal
You may well have drawn one of these by hand already. Keeping it in an app is a straight trade: you lose the pleasure of filling a square with a pen, and you gain a grid that can also tell you what those colors had in common. Plenty of people do both, and there's nothing wrong with that.
Numbers don't do anything for you
An average of 6.8 is a fact you can read and immediately forget. A block of colour is something you react to before you've finished looking at it. If graphs have never held your attention, this is the view worth starting with. It's the same data doing a completely different job.
You want a record of a particular year
A first year somewhere new, a year of treatment, a year after a loss. Years like that get flattened by memory into a single feeling, usually the one you ended on. A grid keeps the shape of it, including the good stretches that the ending tends to overwrite.
Common questions
Can I start partway through the year?
Yes, and most people do. A partial grid is still a grid, and the patterns that matter most (weekly rhythms, runs of similar days) start showing after a couple of months. A grid begun in August has five months in it by New Year, which is five more than one you never started.
How many colors should I use?
Five is the usual answer. Varied enough to be interesting, few enough that you can choose one in a second without deliberating over whether today was a six or a seven. Three is too coarse to show anything; ten makes the nightly choice a chore.
What if I log more than once a day?
Luci averages the day into a single square, exactly as a paper grid would.
Can I see more than one year?
Yes: a month, a season, a year, or everything you've logged. Some patterns take two or three years to form and are invisible inside any single year.
What can't a Year in Pixels tell me?
Why. It shows you when, precisely and beautifully, and it has no idea what was different about that fortnight in February. The grid is where questions start rather than where they're answered, which is what the tags and statistics are for.
Start where you are
Luci is free, works offline, and asks for about ten seconds a day. No account needed.